TOC
Introduction
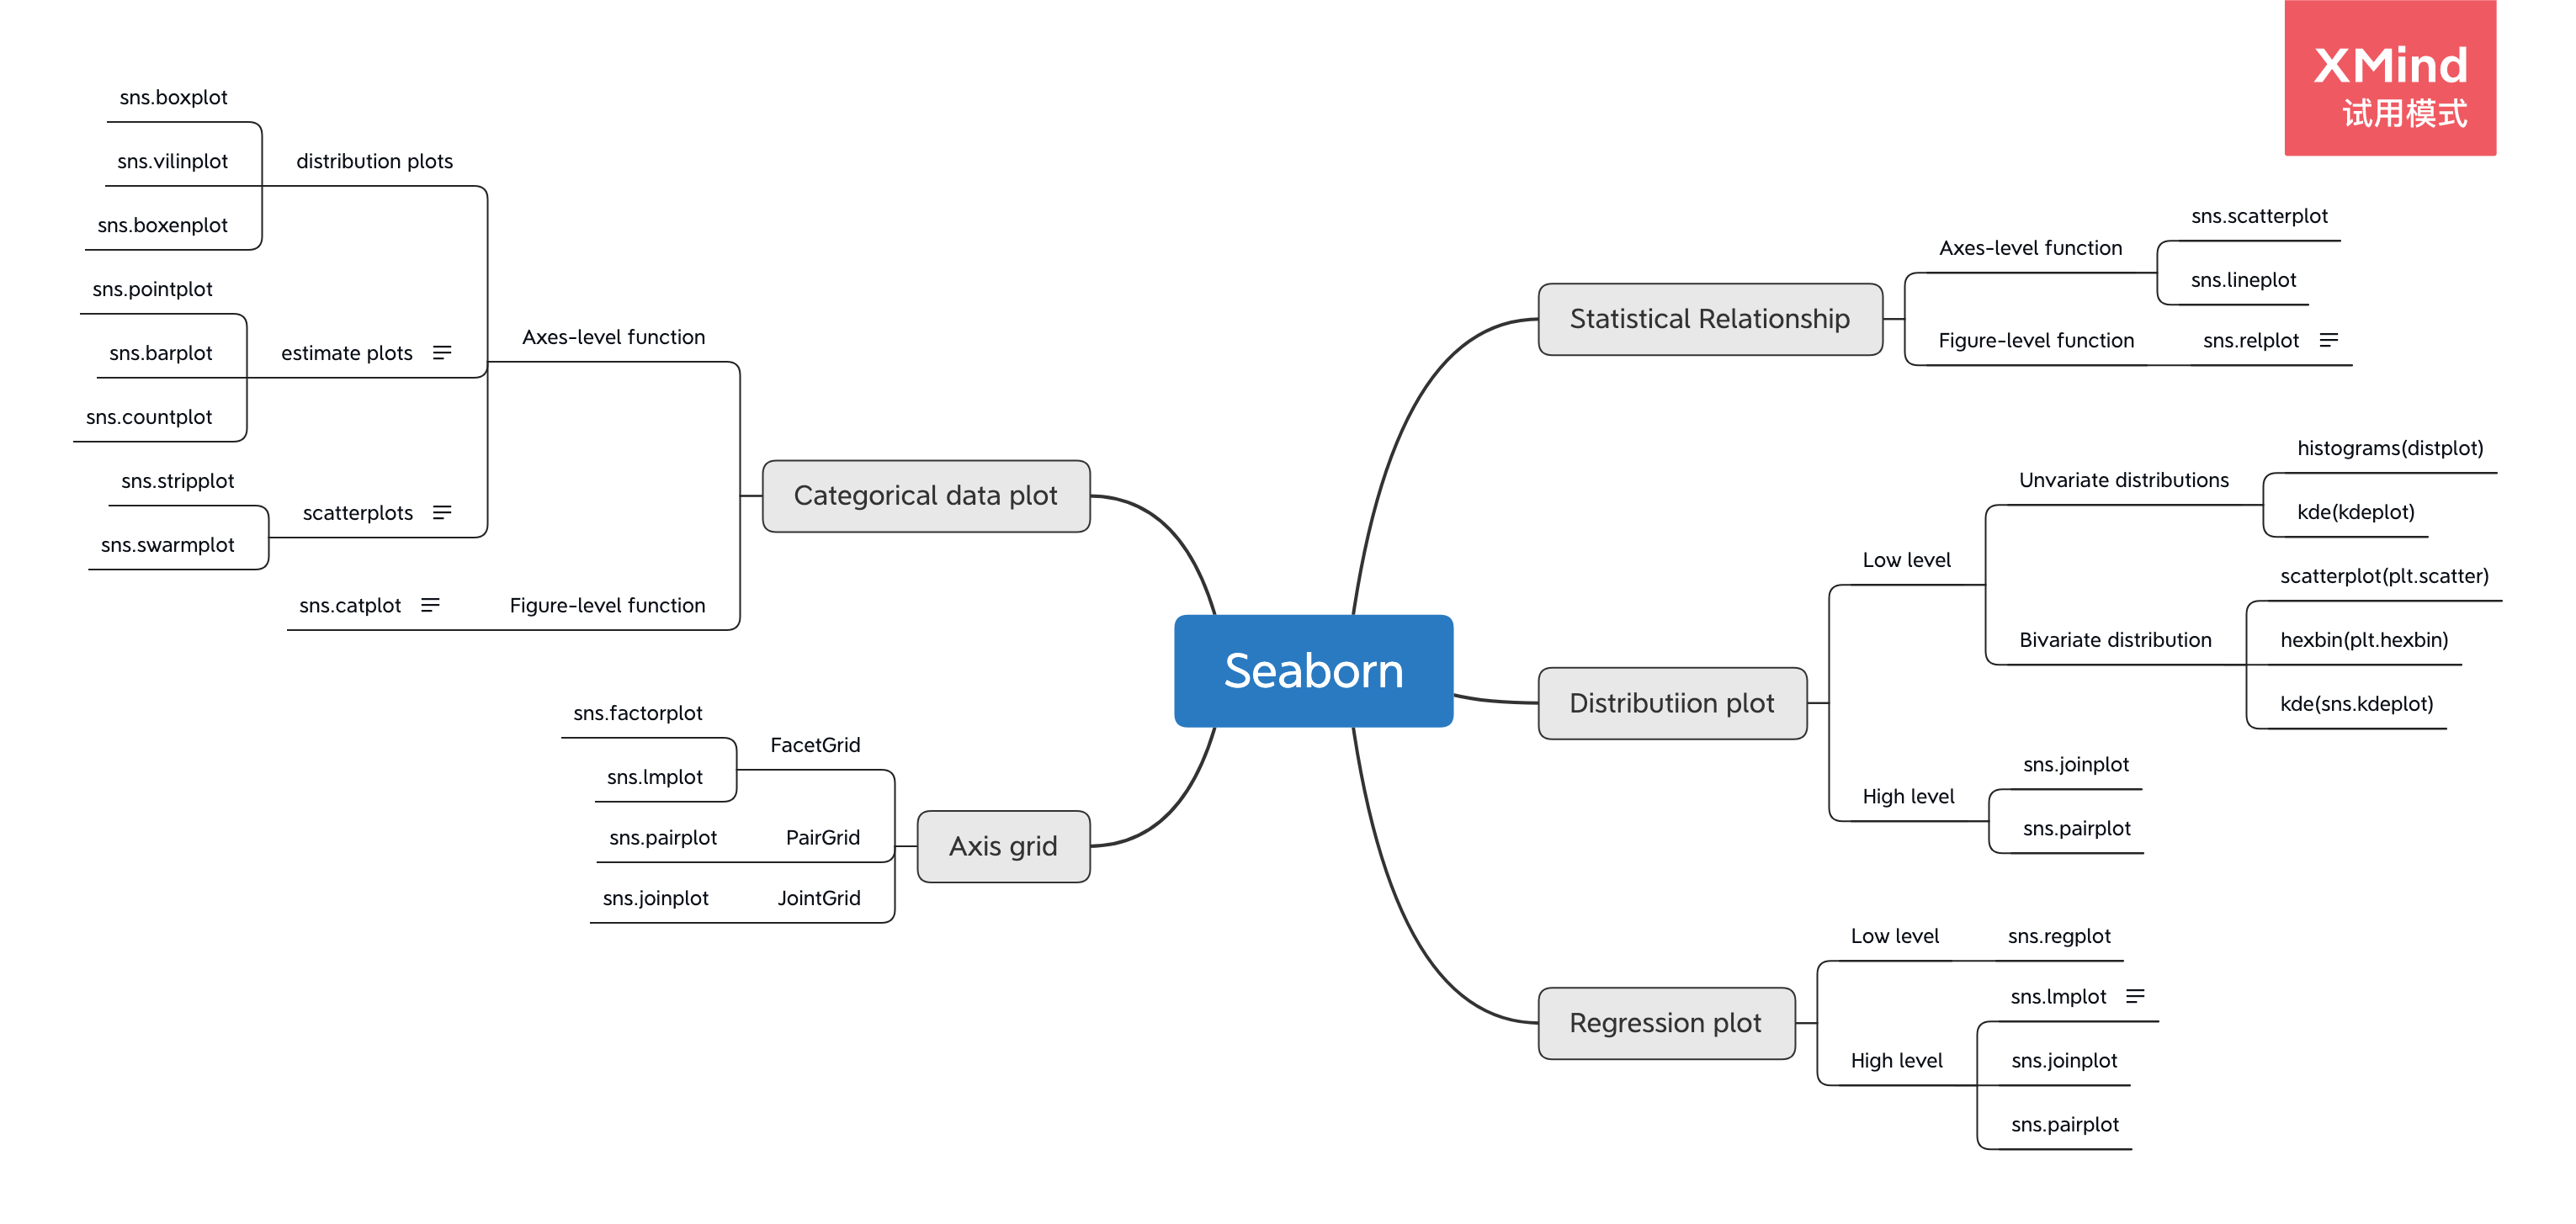
Seaborn is a Python package to make statistical graph. It’s built on matplotlib and is closely intergrated with pandas package. Of course, we don’t need to know it’s design logic in order to use it. However, if we know the design logic behind seaborn, it’ll be easy to find a visualization solution with seaborn when facing a problem.
Matplotlib
Notes about two types of interface:
- Object-Oriented API: this module utilzes the instance of axes.Axes to render the visualization on the instance of figure.Figure.
- State-based interface - Pyplot: this module is based on MATLAB, and this module is encapsulated within the matplotlib.pyplot module.
Two things to keep in mind:
- Axes represents a individual plot
- Figure is the final image which can contain one or more Axes.
Seaborn
There are four types of “figure-level” functions in seaborn which are: sns.relplot(), sns.catplot(), sns.joinplot() and sns.pairplot(). These high level functions are building on two basic categories of functions: ‘axes-level’ functions and axes grids. Below is a mind-mapping of these logic: